Australia’s creative burden is real. New research from Cape.io shows that the industry’s creative output has surged 121% since 2022, while campaigns grew by just 44% and marketing team growth lagged. Cape.io’s inaugural Creative Burden Index 2026 has measured the global creative workload, including the APAC region, revealing the true cost of rising creative demands on the advertising industry.
The report used four years of production data from Cape.io, which contains more than 700,000 creative files and 54,000 campaigns. It found that while campaigns grew by 44%, the typical brand now produces more than twice as many individual creative files as it did in 2022, with the number of files inside each campaign increasing by 121% over the period.
The increasing demand from platforms for creative content has outstripped both campaign growth and human production capacity, resulting in what the report describes as the “creative burden”. While creative output has more than doubled, marketing teams have expanded by between just 2.5% to 5.5% annually.
According to the report, the number of files produced per campaign increased from 10 to 16 between 2022 and 2026, up 58%. Static images now account for the largest share of creative output, rising to 3.9 times their 2022 volume, while video output has grown 3.4-fold.
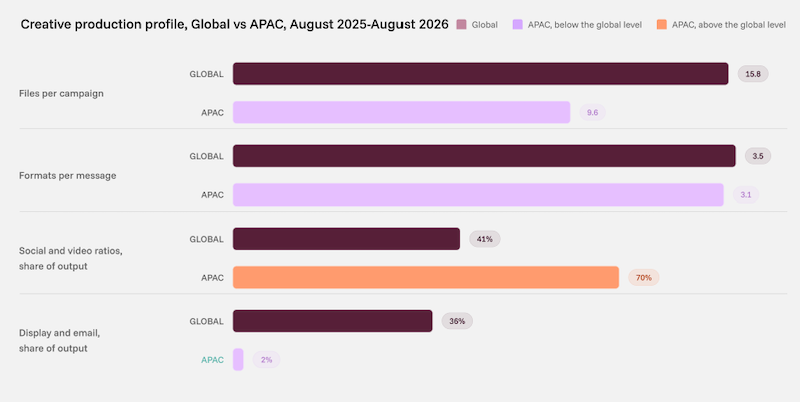
Australia and the broader Asia-Pacific region face a slightly different creative burden than the rest of the world, producing around 9.6 files per campaign, compared to 15.8 globally. However, social and video content accounts for a much larger share of output across APAC, representing 70% of creative production, compared to 41% worldwide.
Across APAC, the telco and media sector recorded the fastest growth in creative burden, with output quadrupling since 2022, and the sharpest increase occurring in 2025/2026. The travel sector’s creative burden has also climbed since 2022, increasing 2.4-fold, following steady annual growth.
The growing creative burden now costs a typical brand an average of AU$3.3 million annually, the report says, up from AU$1.5 million in 2022 if they’re doing the work manually. This figure is projected to reach AU$9.6 million by 2030, when brands are expected to produce 6,400 creative files annually, compared to 1,000 in 2022.
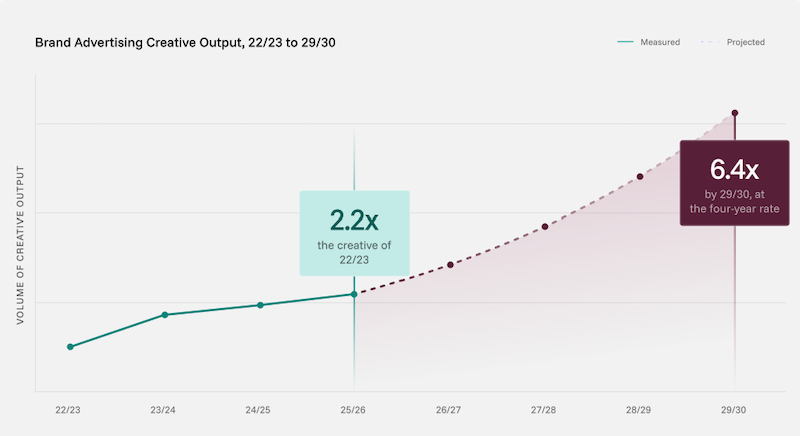
The report forecasts annual creative burden growth of between 13% and 30%, warning that demand could climb even further if platforms make more significant changes in response to evolving user behaviour.
Cape.io vice president for APAC, Andy Gilroy,stated, “Audiences are becoming savvier about advertising, and platforms are becoming increasingly smarter about how they reach them. Every scroll, pause and skip provides a signal that platforms use to optimise performance, driving demand from advertisers for more formats, ratios and creative versions to serve the right message to the right audience. To keep ads performing, brands need to continually feed the algorithm with fresh creative.
“Since 2022, the number of campaigns has grown by 44% and the number of creative files within them rose by 121%. That gap is the creative burden brands are faced with. The last four years explain how the burden arrived – but the next four tell us what needs to be planned for. The question isn’t whether the creative load grows, it’s how steep the slope will be and how production models will cope.
“As marketers increasingly adopt Generative AI to meet this exploding demand, the bottleneck is shifting beyond just creative production. Now, the challenge is no longer just producing the creative, but validating and trusting the creative before it goes live across 10 or more channels is critical as well. It’s therefore imperative that quality assurance is built in to address any compliance gaps before creative goes live.”
The report reveals an unsustainable cycle where audiences move, platforms respond and brands pay the bill. Companies now market across an average of 10 channels and every change made by platforms moves the decision on creative away from the marketer and into a platform’s automation, so the only way forward is to provide more and more creative options.
“This gap is the creative burden that brands are now facing. The same campaign now delivers in more sizes, ratios and media types, with the workload growing at 5.5 to 13 times the rate of the teams producing it. Personalisation has exploded, but marketing teams and budgets simply haven’t kept pace with the growing demands,” Gilroy noted.
“The question now isn’t whether the creative burden will grow, but how quickly, and whether a brand’s production model is built for it. Media, email and measurement were automated years ago, but creative production is still done by hand a lot of the time, one file at a time.
“We recommend that marketers start mapping their creative burden now by tracking a campaign, from brief to launch, and really examining each element along the way. Identify where the work repeats, and then prioritise automated, governed production where it will deliver the greatest return. Brands need to build a production model that integrates compliance controls. By doing this, teams can handle the creative burden upfront, scaling their output without placing unsustainable pressure on budgets.”
“Based on the global rate of change, APAC has between two and four years before it catches up. Brands need to spend time now identifying where their creative burden is coming from and building a production model that can scale with demand, improve efficiency, and support greater creative output, without placing unsustainable pressure on teams and budgets.”
The Creative Burden Index was collated from Cape.io proprietary data, drawn from more than 700,000 creative files, 215,0000 distinct creative variations and 54,000 campaigns created between 2022 and 2026.






Leave A Reply